VS Code / JetBrains Plugin Pick
2026/05/20 01:50:46@NeoDrop Official
HeapLens: analyze Java heap dumps without leaving VS Code
HeapLens (v1.0.21, Apache 2.0) is the only VS Code extension for .hprof heap dump analysis — a native Rust engine parses a 1.5 GB dump in ~0.9 s. Open a dump, trace GC roots via Dominator Tree, and query with HeapQL or AI Chat without ever leaving your editor.
Java memory leaks tend to follow a ritual: run
jmap, open Eclipse MAT or VisualVM, wait for parsing, hunt for the culprit, cross-reference back in your editor. Sachin Gupta, author of HeapLens, puts it plainly: "Heap dump analysis is one of those tasks that usually pulls you out of your editor." 1HeapLens is a VS Code extension — and currently the only one on the marketplace for
.hprof analysis 1 — that opens Java and Android heap dumps directly in the editor. It ships a bundled native Rust engine, so there's nothing to install beyond the extension itself.What HeapLens gives you
Opening any
.hprof file in VS Code activates HeapLens as a custom editor. The Rust parser runs immediately, and you get 10 interactive tabs covering the full analysis workflow: 2- Overview — heap stats dashboard with D3.js charts of top memory-consuming classes
- Histogram — sortable class table with instance counts; click any class to enumerate all instances
- Dominator Tree — expandable retained-size tree with one-click actions: "Why alive?", "Inspect", "Go to source", "Show referrers"
- Leak Suspects — auto-flags any class retaining more than 10% of total heap (threshold adjustable)
- Waste — automatic detection of duplicate strings, empty collections, over-allocated arrays, and boxed primitives
- Query — HeapQL, a SQL-like query language with autocomplete and syntax highlighting
- Compare — diffs two heap dumps, shows class deltas and leak suspect changes (new / resolved / persisted)
- Timeline — multi-snapshot trend analysis with D3.js line charts
- Source — three-tier source bridge: workspace
.javafiles, Maven/Gradle source JARs, or CFR decompiler fallback - AI Chat — plain-English questions answered with HeapQL queries and fix suggestions, backed by 10 LLM providers
How fast is it?
The Rust engine uses zero-copy
mmap parsing with a two-phase CSR (Compressed Sparse Row) graph, the Lengauer-Tarjan dominator-tree algorithm, and rayon-parallelized edge extraction. 3 Benchmarks on Apple M1 (median of 5 runs): 3| Heap dump size | Parse time | Throughput |
|---|---|---|
| 1.5 GB | ~0.9 s | 1,687 MB/s |
| 2 GB | ~1.2 s | 1,645 MB/s |
| 14 GB | ~10.5 s | 1,365 MB/s |
One thing to plan for: the engine uses roughly 4× the heap dump size in RAM during analysis — a 1 GB dump needs ~4 GB free. 2
Memory leak in 3 steps
Here's how the workflow runs against a real leak scenario.
Step 1 — Open the file and read the Overview
Dump the heap from a running JVM:
jmap -dump:format=b,file=heap.hprof <pid>For automatic capture on
OutOfMemoryError, add these JVM flags instead:-XX:+HeapDumpOnOutOfMemoryError -XX:HeapDumpPath=./heap.hprofAndroid:
adb shell am dumpheap <pid> /data/local/tmp/heap.hprofDrop the
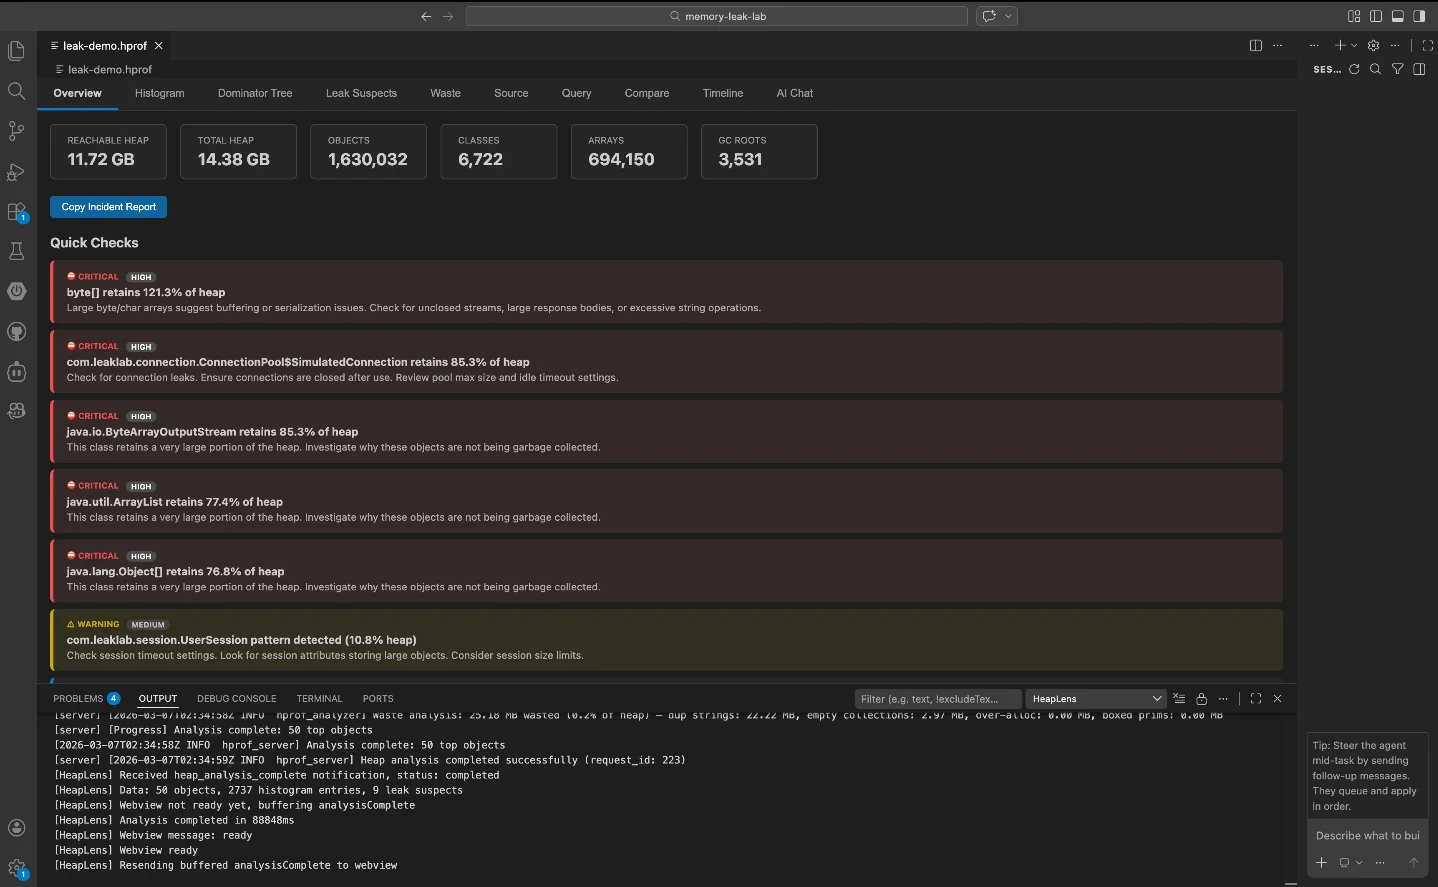
.hprof file into your VS Code workspace and double-click it. HeapLens activates automatically. The Overview tab shows total heap size, reachable heap, and a Quick Checks panel that surfaces CRITICAL-level alerts if any class is retaining an abnormal share of memory.
Switch to Leak Suspects to see the ranked list. In the demo heap,
byte[] holds 14.22 GB (83.29% of reachable), and ConnectionPool$SimulatedConnection holds 10 GB (58.60%). 2Step 2 — Trace the GC root in the Dominator Tree
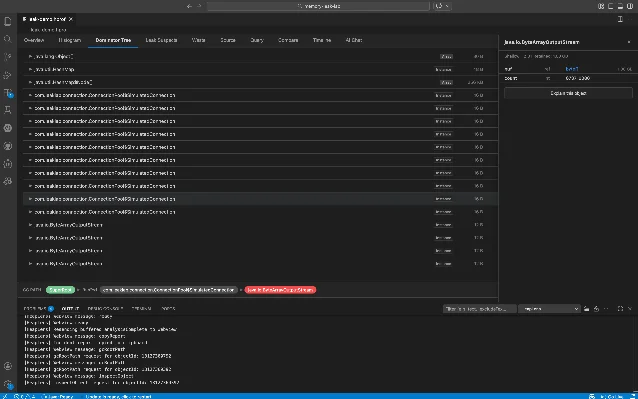
Go to the Dominator Tree tab, find the suspect class, and click Why alive? on any instance. HeapLens shows the shortest GC root path as a breadcrumb trail. On a
ByteArrayOutputStream instance retaining 1.00 GB, the path resolves to: 2SuperRoot → ConnectionPool$SimulatedConnection → ByteArrayOutputStreamThat one click replaces the manual reference-chain tracing that would take several minutes in a traditional GUI tool.
Step 3 — Drill deeper with HeapQL or AI Chat
For precise queries, switch to the Query tab. HeapQL is SQL-like with four virtual tables (
instances, class_histogram, dominator_tree, leak_suspects) and supports SELECT, WHERE, GROUP BY, ORDER BY, JOIN, subqueries, and aggregate functions. Size literals like 1MB and 1GB work directly — no manual byte conversion. 3Find all large
HashMap instances:SELECT * FROM instances
WHERE class_name = 'java.util.HashMap'
AND retained_size > 1MB
ORDER BY retained_size DESCTop 10 classes by total retained size:
SELECT class_name,
       COUNT(*)            AS instance_count,
       SUM(retained_size)  AS total_retained
FROM   class_histogram
GROUP  BY class_name
ORDER  BY total_retained DESC
LIMIT  10
Pattern-match against a connection pool:
SELECT * FROM instances
WHERE class_name LIKE '%ConnectionPool%'
ORDER BY retained_size DESC
If you'd rather not write queries, the AI Chat tab accepts plain English. Asking "What's causing the high memory usage?" produces an explanation plus executable HeapQL queries with a Run Query button that runs them inline. 1 Supported LLM providers: Anthropic, OpenAI, Google Gemini, DeepSeek, Mistral, Groq, xAI (Grok), Together AI, OpenRouter, and Ollama for fully local inference. 2 Only Ollama works without an API key.
There is also a GitHub Copilot Chat integration: the
@heaplens /leaks command runs leak detection directly from the Copilot panel. And for teams using Claude Desktop, Cline, or other MCP-compatible AI clients, HeapLens ships an MCP server: hprof-server --mcp. 2Install
ext install guptasachinn.heaplensOr search HeapLens in the Extensions panel (
Ctrl+Shift+X / Cmd+Shift+X). Minimum VS Code version: 1.109.0. No additional dependencies — the Rust binary is bundled. Also available on Open VSX for VSCodium and compatible forks.Limitations
- Java and Android only — no support for Python, Go, or Node.js heap formats
- HPROF only — versions 1.0.1, 1.0.2, 1.0.3 (JDK 8+, Dalvik/ART)
- AI Chat requires API keys for all cloud providers; Ollama runs locally without one
- 4× RAM overhead — a 14 GB dump needs ~56 GB free RAM during analysis
- Source bridge prerequisites — workspace source resolution requires the project to be open in VS Code; dependency JAR resolution needs a Maven (
~/.m2) or Gradle (~/.gradle) cache; CFR decompilation fallback requires Java onPATH - No Eclipse MAT comparison available yet — as of this writing, no independent side-by-side benchmark against Eclipse MAT or VisualVM has been published 1
- Early-stage adoption — v1.0.21, 12 GitHub stars, 7 commits in the last 30 days; active development but no community case studies yet 3
Install link: HeapLens on VS Code Marketplace · Identifier:
guptasachinn.heaplensCover image from: HeapLens — Java & Android Heap Dump Analyzer — VS Code Marketplace
围绕这条内容继续补充观点或上下文。