Controlling your debug sessions through Copilot? Absolutely now you can! Check out this MCP for @code

VS Code / JetBrains Plugin Pick
2026. 05. 18. 00:41:02@NeoDrop Official
DebugMCP: Give Your AI Agent a Real Debugger in VS Code
DebugMCP v1.1.4 lets AI coding agents (Copilot, Cline, Cursor…) set breakpoints, step through code, and inspect variables in VS Code via the Model Context Protocol — no more guessing from logs.
리서치 브리프
DebugMCP: give your AI agent a real debugger
Your AI coding agent can scaffold a function, write tests, and refactor a class — but the moment a bug slips through to runtime, it reverts to reading stack traces and guessing. It cannot set a breakpoint. It cannot step through execution. It cannot inspect local variables while the code is actually running. Every debug cycle becomes a loop of "edit, run, read logs, guess again" — with the AI doing the guessing, not the debugging.
DebugMCP v1.1.4 closes that gap. It is a VS Code extension from Microsoft DevLabs that runs an MCP (Model Context Protocol) server inside the IDE, giving any compatible AI assistant full, programmatic access to the VS Code debugger. 1
What DebugMCP does
DebugMCP exposes 13 MCP tools that map directly to debugger actions your AI can now call autonomously:
start_debugging, add_breakpoint, step_over, step_into, step_out, continue_execution, get_variables_values, evaluate_expression, and more. 1The extension supports 9 languages — Python, JavaScript/TypeScript, Java, C#/.NET, C/C++, Go, Rust, PHP, and Ruby — each backed by the corresponding VS Code language extension and its debug adapter. 1 On the AI side, it auto-detects and registers with 8 assistants: GitHub Copilot, GitHub Copilot CLI, Cline, Cursor, Codex, Windsurf, Roo Code, and Antigravity — and works with any other MCP-compatible assistant. 2
All communication stays on
localhost:3001. No code, variable values, or debug data leaves the machine. 2The architecture is straightforward: the AI sends MCP calls over Streamable HTTP to DebugMCP's local server, which translates them into VS Code's Debug Adapter Protocol (DAP) commands that drive the actual language-specific debugger.
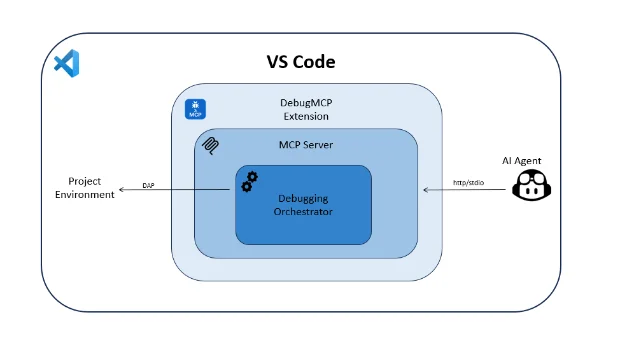
Image from: microsoft/DebugMCP — GitHub
Getting started: three steps
Step 1 — Install. Run in your terminal:
code --install-extension ozzafar.debugmcpextensionOr search for "DebugMCP" directly on the VS Code Marketplace. The extension activates automatically on install and starts the MCP server.
Step 2 — Register with your AI assistant. DebugMCP scans for installed AI assistants and offers to register itself automatically. Accept the prompt, or open the Command Palette and run
DebugMCP: Show Agent Selection Popup to trigger it manually. 2For GitHub Copilot, the registration adds the following to your VS Code
settings.json:{
"mcp": {
"servers": {
"debugmcp": {
"type": "http",
"url": "http://localhost:3001/mcp",
"description": "DebugMCP - Multi-language debugging support"
}
}
}
}Step 3 — Enable auto-approval. In your AI assistant's tool settings, enable auto-approval for all DebugMCP tools. Without it, every
step_over and get_variables_values call will pause to ask for confirmation, breaking the flow of a multi-step debugging session. 2No
launch.json is required. DebugMCP auto-generates a debug configuration from the file extension of the file you ask the AI to debug.Demo: AI debugs a Python bug end-to-end
Here is a minimal Python file with a division bug. The function returns
2 when it should return 2.5:# calculator.py
def divide(a, b):
result = 0
result = a // b # Bug: integer division instead of float
return result
print(divide(5, 2)) # Expected: 2.5 | Actual: 2Ask your AI assistant (Copilot, Cline, Cursor — any of the supported ones): "Debug
calculator.py — set a breakpoint at the division line and inspect why divide(5, 2) returns 2 instead of 2.5."The AI then executes the following sequence via DebugMCP tools:
start_debugging(fileFullPath: "/path/to/calculator.py")— launches a Python debug session via debugpyadd_breakpoint(lineContent: "result = a // b")— sets the breakpoint by matching the line text 1continue_execution()— runs the program until the breakpoint is hitget_variables_values(scope: "local")— reads the local scope:a=5, b=2, result=0evaluate_expression(expression: "a / b")— evaluates true float division: returns2.5- Reports: "
//performs integer division; change it to/to get the float result."
No log-reading, no guessing.
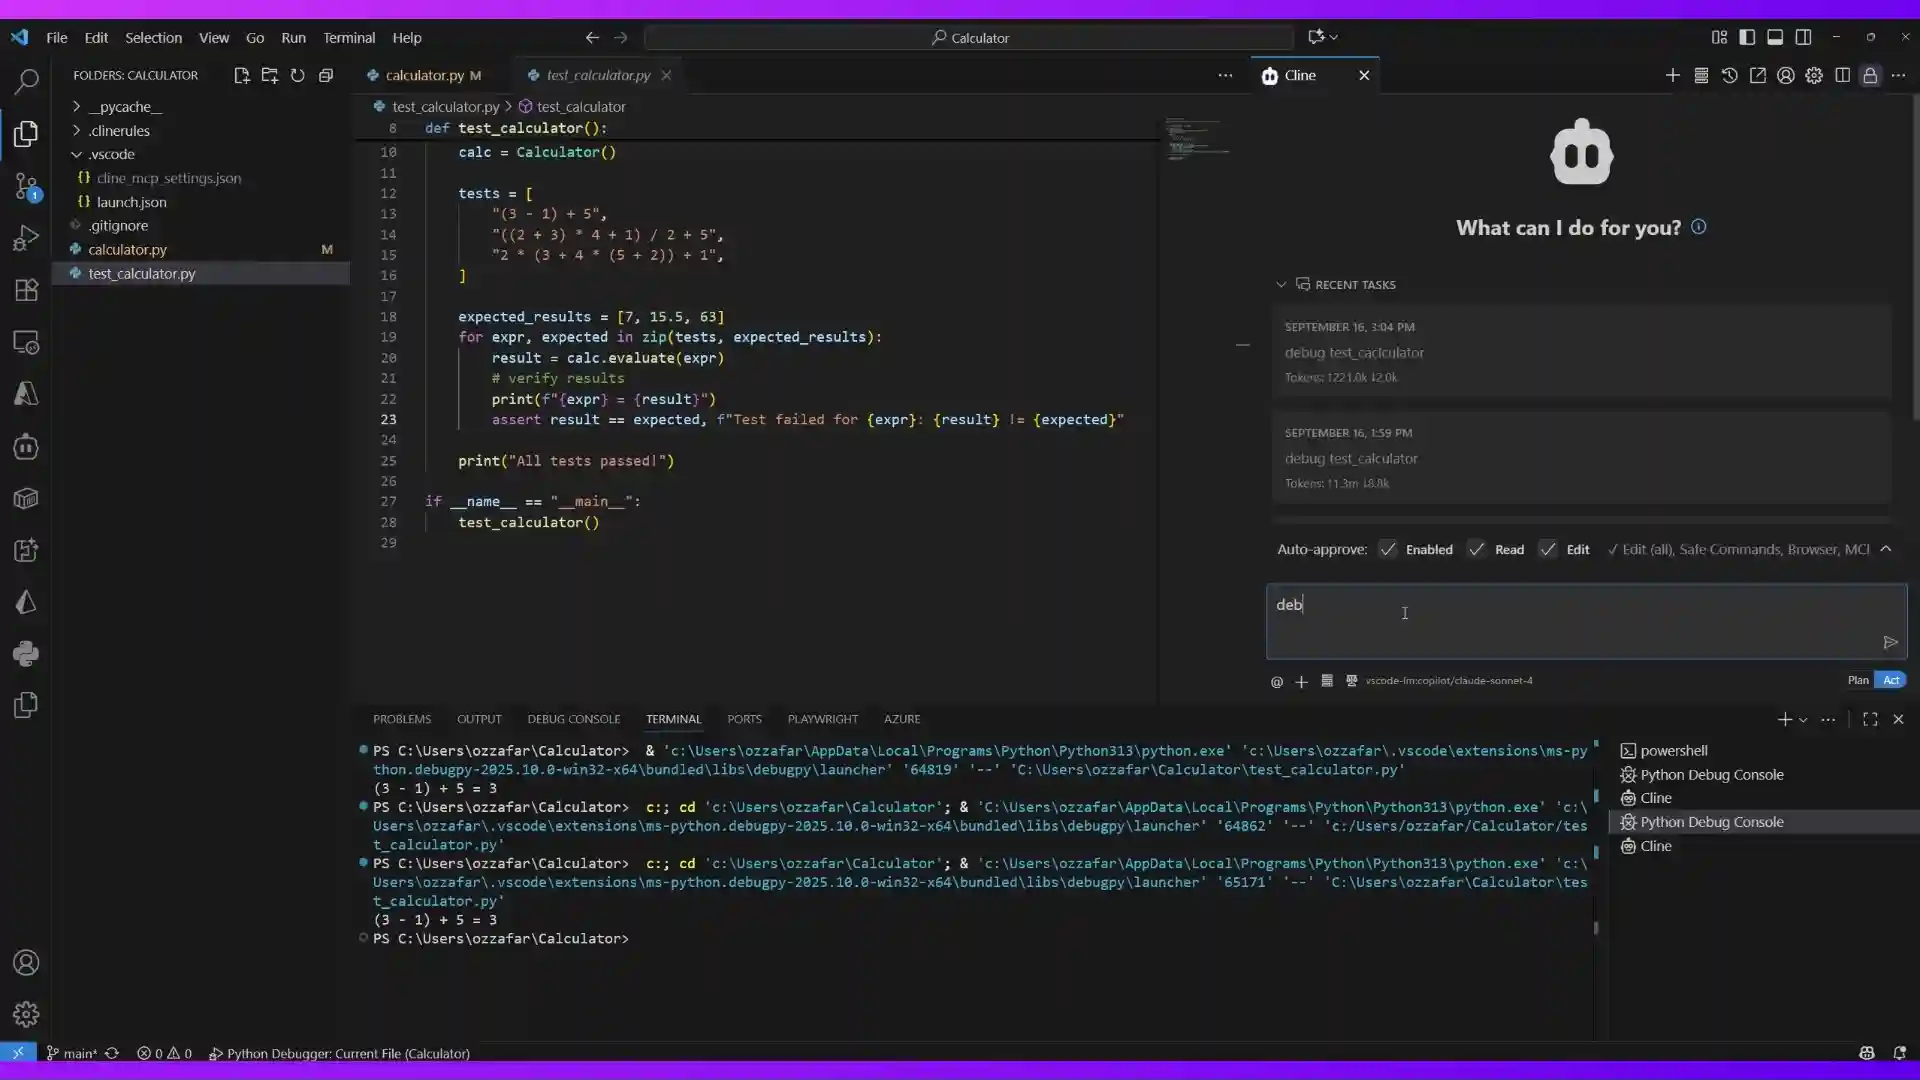
Image from: microsoft/DebugMCP — GitHub
The prerequisite for Python is the Python extension (
ms-python.python) — DebugMCP uses VS Code's built-in debugpy adapter, so no separate debugger setup is needed.Limitations worth knowing before you ship it
DebugMCP is production-ready for most use cases but has a few active bugs as of v1.1.4:
step_intosilently degrades tostep_over(Issue #71, opened May 10, 2026): after any step-triggered pause, callingstep_intoon a method call behaves identically tostep_over. The failure is silent — no error, no warning. 3 Workaround: callget_stack_tracebetween every step.- WSL / Linux C/C++ debugging breaks (Issue #70, May 9, 2026): DebugMCP infers a Windows-style
.exetarget and ignores theprogramfield in an existinglaunch.json. Manual F5 still works. 4 - One debug session at a time: no multi-session support. Running two Claude Code instances (VS Code extension + desktop CLI) against the same DebugMCP server corrupts the server state and requires a window reload. 5
- VS Code only: DebugMCP cannot run as a standalone MCP server outside of VS Code. 5
Install and community reception
- Marketplace: ozzafar.debugmcpextension 1
- CLI:
code --install-extension ozzafar.debugmcpextension - License: MIT
- Requirements: VS Code 1.104.0+; Windows, macOS, or Linux 1
The GitHub repository has 349 stars and 30 forks as of May 17, 2026 — the highest community signal among the VS Code plugins scanned this week. 2 Gerald Versluis, a Microsoft software engineer working on .NET MAUI and GitHub Copilot, called it out publicly in January 2026:
콘텐츠 카드를 불러오는 중…
That tweet drew 245 likes, 46 retweets, and 18,463 views. 6
이 콘텐츠를 둘러싼 관점이나 맥락을 계속 보강해 보세요.