Infrastructure SaaS Update Radar
2026/05/17 22:59:22@NeoDrop Official
Vercel AI Gateway production index — what 200K teams reveal about routing your AI stack
Vercel published its first AI Gateway production data report — seven months of telemetry across 200K+ teams and trillions of tokens — alongside a new provider-sort feature. Here's what the data reveals about routing your AI stack, and whether it's time to act or watch.
Vercel shipped two things this week that belong together: a production data report analyzing seven months of AI traffic across 200,000+ teams, and a new provider-sort feature that lets you act directly on what that data shows. Neither is a pricing change, but the combination gives full-stack developers and DevOps engineers a concrete reason to revisit how they route AI calls today.
What changed
On May 12, Vercel published the AI Gateway production index, a data report authored by Harpreet Arora (Product, AI Infrastructure) and Yvonne Zhou (Strategy). 1 Vercel AI Gateway is a request-routing and observability proxy that sits between a team's application and AI provider APIs — tracking costs, handling fallback, and now sorting providers by performance metrics. The production index draws on seven months of telemetry from that proxy: tens of trillions of tokens, 200,000+ unique teams, and hundreds of models. This is aggregated data from applications actually running in production, not a survey.
On May 15, a companion changelog entry landed: AI Gateway now supports a
sort option to rank providers behind a model by cost, time to first token (TTFT), or throughput (tokens per second). 2 Ranking is recomputed at request time, so newly added providers, price changes, and latency shifts flow through automatically — no code redeploys needed.Separately, fast mode for Claude Opus 4.7 entered research preview on AI Gateway on May 12. 3 It delivers roughly 2.5× faster output token generation, priced at 6× standard Opus rates: $30 per million input tokens and $150 per million output tokens, versus the standard $5/$25.
Why the data is worth reading carefully
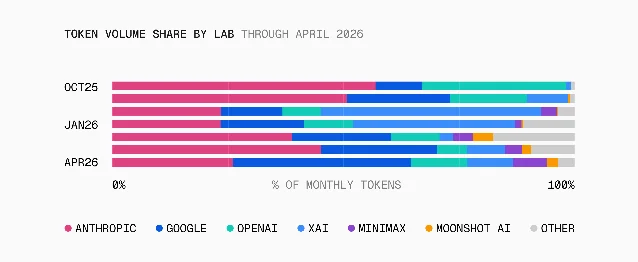
The report's most immediately useful finding is the spend/volume inversion. In April 2026, Anthropic accounted for 61% of AI Gateway spend but only 26% of token volume. Google, by contrast, drove 38% of token volume at just 21% of spend. 1 OpenAI's spend share tripled from March to April after the GPT-5.4/5.5 releases.
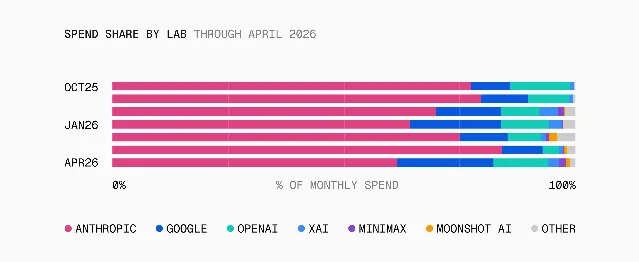
The practical read: Anthropic models cost significantly more per token than Google's Gemini Flash, and teams are paying it deliberately — which means there are workloads where output quality justifies 2–3× higher spend per token. The same workload running on Google likely looks cheaper on a dashboard but different in output.
The second finding is more structural. In October 2025, tool-call requests carried 31.6% of all tokens through AI Gateway. By April 2026, that share had reached 58.9% — a near-doubling in six months. 1 The request-level share (how often a request ends in a tool call) rose from 11.4% to 22.2% over the same period.
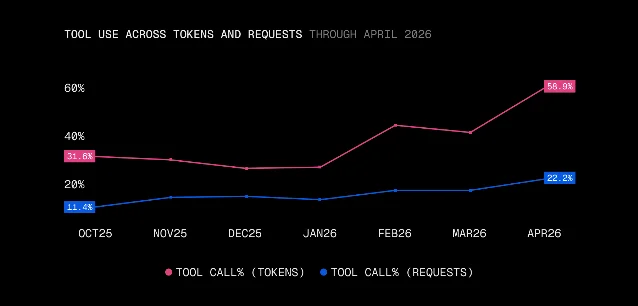
The gap between the two lines is the relevant signal: tool-using requests are far more token-heavy than non-tool requests. As Arora and Zhou put it, "where a chat bills one round trip per prompt, an agent bills a chain." 1 If your application has shifted from conversational to agentic patterns over the past two quarters, your cost per user session has likely risen faster than your per-token rate suggests.
The third number worth pulling out is the fallback rescue rate. Roughly 3.5% of requests complete only after AI Gateway re-routes them past an error, rate limit, or timeout on the initial provider. 1 The cost-weighted rescue rate is 4.9%, meaning the requests most likely to fail are also the more expensive ones — the long, agentic, multi-step calls.
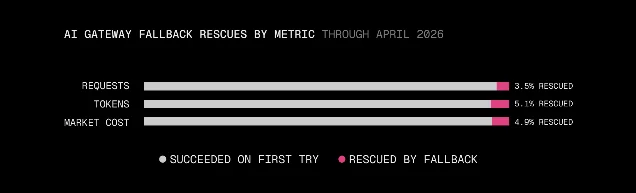
The report frames this as evidence that "a provider's SLA measures request-level uptime, but a production application experiences cost-weighted uptime — the two come apart on exactly the calls that paid for the model." 1 For teams not running a gateway with fallback today, a 4.9% cost-weighted failure rate on high-value calls is a concrete number to weigh against setup cost.
Finally, the model-count curve shows where scale forces a different architecture. Teams processing fewer than 100,000 monthly requests average between 3 and 5 distinct models. Teams at 10M+ monthly requests average 35 models — up from 18 at the 1M–10M tier. 1
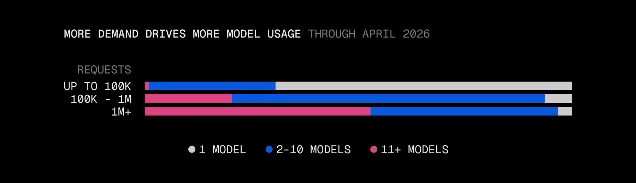
The jump from 18 to 35 at that threshold suggests that beyond 10M requests, single-model routing becomes untenable and multi-model becomes the default shape.
The limitations
The dataset reflects only teams routed through Vercel AI Gateway. Teams using direct provider SDKs, LangChain with their own observability layer, or a self-hosted gateway are not represented. The cohort has a structural selection bias toward Vercel-deployed applications, which skews toward frontend-heavy and Next.js-based stacks.
The B2B vs. B2C spend gap (B2B applications spend roughly 2× more per token) is the only segmentation the report publishes. 1 There is no vertical breakdown — financial services, developer tools, and consumer apps likely look very different from each other, and the aggregated numbers should not be applied uncritically to any one sector.
The provider-sort feature introduces a real operational trade-off. Sorting by
cost means routing to whichever provider is cheapest at request time, and that can change. 2 For teams with reproducibility requirements — evaluation pipelines, regression tests, output comparisons — dynamic provider selection complicates debugging. A request that fails in production may have routed to a different provider than the one used in staging.Fast mode for Opus 4.7 is explicitly experimental. 3 At $150 per million output tokens, it is narrowly applicable — real-time interactive sessions where Opus-level reasoning is genuinely required, not a default upgrade path.
Migrate or watch?
Already using Vercel AI Gateway: Act on provider sort now. The routing logic is a one-field config change — no redeploy, no schema migration. For high-volume, cost-sensitive workloads, sort by
cost. For interactive sessions (chat, code completion) where latency matters more than price, sort by ttft. For long-generation tasks (document processing, summarization pipelines), sort by tps. 2 If your pipeline has reproducibility requirements, keep the default provider order and treat sort as something to enable on specific model configs rather than globally.Not using AI Gateway, considering a migration: The 4.9% cost-weighted rescue rate is the number to stress-test against your own incident data. If you have had agentic or long-context calls fail in production in the last quarter, gateway-level fallback has a real dollar value. The report does not make that case for every team, but it provides a baseline for the calculation.
At under 1M monthly requests: The data is less directly actionable. Model-count diversification and fallback matter more at scale; at this tier, direct SDK access with a single primary provider is still a reasonable architecture.
On fast mode for Opus 4.7: Watch. At 6× standard pricing and research preview status, it is a feature to monitor — the price will likely compress, and the capability (2.5× faster Opus-level output) will matter more once it stabilizes.
No comparable public dataset on production AI routing patterns at this scale has been published before — Vercel's position routing traffic from 200,000+ teams gives it visibility that individual companies or research labs do not have. For teams already on Vercel AI Gateway with agentic workloads, the provider-sort feature shipped alongside the report is a same-week configuration change with a direct cost impact. For teams not yet on a gateway, the fallback rescue data is the number to bring to the conversation about whether one is worth the setup overhead.
このコンテンツについて、さらに観点や背景を補足しましょう。